


VMT chart still in Peak Oil mode
Leave a Comment so far
Leave a comment
April 22, 2013, 19:57
Filed under: Uncategorized | Tags: energy, gasoline production, Peak Demand, peak oil, transportation, US oil consumption, vehicle miles traveled, VMT< DOT
Filed under: Uncategorized | Tags: energy, gasoline production, Peak Demand, peak oil, transportation, US oil consumption, vehicle miles traveled, VMT< DOT
No coherent explanation for the way the years are labeled across the bottom however.
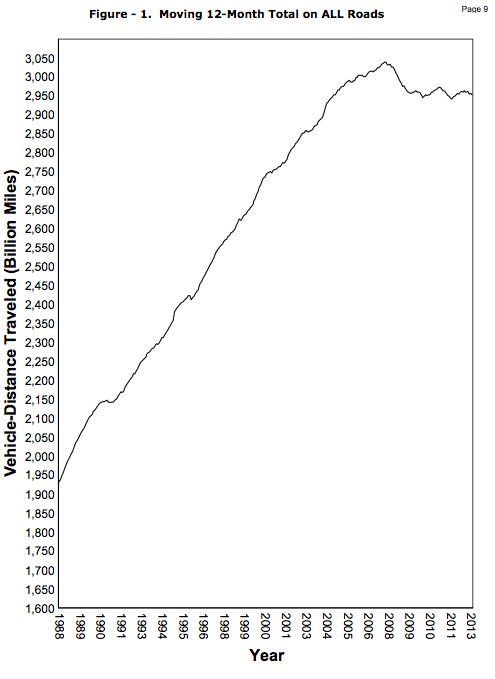
Data through February.
via (pdf) http://www.fhwa.dot.gov/policyinformation/travel_monitoring/13febtvt/13febtvt.pdf
Leave a Comment
Leave a Comment so far
Leave a comment
