


Filed under: Uncategorized | Tags: 2020, driving, fatalities per mile traveled, fatality rate, motoring, NHTSA, nsc, traffic fatalities, US transportation, vehicle miles traveled
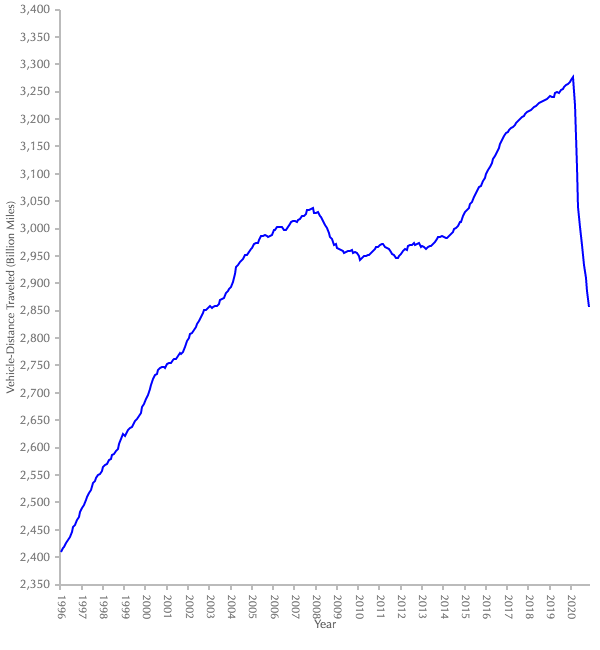
That’s strikingly bad. Total fatalities up 8% over 2019, while fatality rate per vmt rose 24% by one estimate.
Source: Driving Was Down In 2020, But Traffic Fatality Rates Surged : NPR
Filed under: Uncategorized | Tags: COVID-19, economy, FHWA, miles driven, pandemic, transportation, United States travel habits, vehicle miles traveled, Vmt, work from home, zoom
Revisiting Vehicle Miles Traveled after several years of looking away in absolute disgust. Below is the moving 12-month average, latest month recorded is November 2020.
https://www.fhwa.dot.gov/policyinformation/travel_monitoring/tvt.cfm
Filed under: Uncategorized | Tags: Americans, climate change, driving, energy, energy consumption, gas prices, pollution, transportation, USA, vehicle miles traveled, Vmt
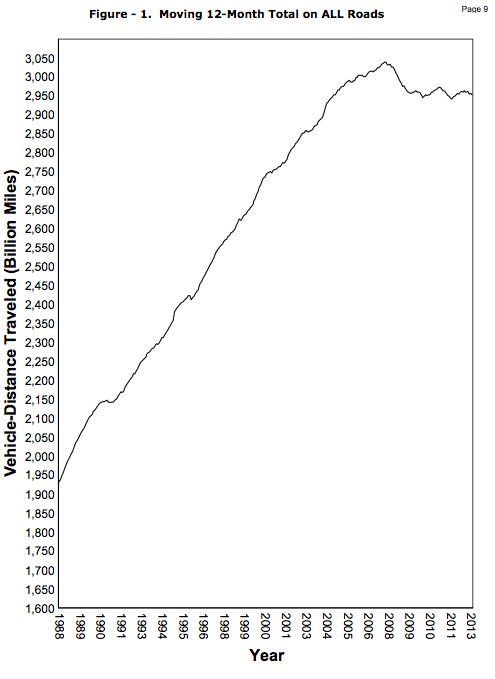
After a few years of sweet reversal of the VMT (Vehicle Miles Traveled) chart, then a few years of bouncing along what looked like a New Normal, things have turned around in a big way. Cheap gas being the primary culprit. Back to our old ways just like that, and making up for lost time.
http://www.fhwa.dot.gov/policyinformation/travel_monitoring/15augtvt/figure1.cfm

Filed under: Uncategorized | Tags: energy, gasoline production, Peak Demand, peak oil, transportation, US oil consumption, vehicle miles traveled, VMT< DOT
No coherent explanation for the way the years are labeled across the bottom however.
Data through February.
via (pdf) http://www.fhwa.dot.gov/policyinformation/travel_monitoring/13febtvt/13febtvt.pdf
Filed under: Uncategorized | Tags: does this make sense, FHWA, say huh, vehicle miles traveled, Vmt, x axis
Notice anything weird about this VMT chart (other than its unusual downward trend that is)? I never noticed it before..
via http://www.fhwa.dot.gov/policyinformation/travel_monitoring/13jantvt/index.cfm

[Mexico vs. USA en vivo ahora..]
Filed under: Uncategorized | Tags: FHWA, oil consumption, traffic volume trends, US oil consumption, US oil demand, vehicle miles traveled, Vmt
Filed under: Uncategorized | Tags: Brent, driving, oil prices, peak oil, vehicle miles traveled, Vmt

click to enlarge
1987-2012
Filed under: Uncategorized | Tags: energy, peak oil, transportation, urban cycling, vehicle miles traveled, Vmt
Interesting times, exhibit 67.
Via http://www.fhwa.dot.gov/policyinformation/travel_monitoring/12jultvt/index.cfm

Filed under: Uncategorized | Tags: DOT, energy, extrapolations, government estimates, peak oil, s, transportation, vehicle miles traveled
I have no idea. Just throwing that out there as a question.
I do know that quantifying the total amount of driving that has occurred on “all roads” by an entire population is necessarily a dark art, prone to wild extrapolations.

Currently not falling off a cliff, according to DOT.
via (pdf) http://www.fhwa.dot.gov/policyinformation/travel_monitoring/12maytvt/12maytvt.pdf
Filed under: Uncategorized | Tags: April 2012, bicycling, cars, DOT, peak oil, transportation, urban cycling, USDOT, vehicle miles traveled, Vmt
The latest govt. numbers. April ’12 down a little over April ’11. 53 months and counting.

Filed under: Uncategorized | Tags: cars, DOT, dot gov, energy, FHWA, oil consumption, oil demand, Peak Demand, transportation, United States, vehicle miles traveled, Vmt
+ 1.8% Over Feb. 2011…
Moving 12-month total.
http://www.fhwa.dot.gov/policyinformation/travel_monitoring/12febtvt/12febtvt.pdf

Filed under: Uncategorized | Tags: albatross, Brent, crude oil, fuel costs, gas prices, gasoline, Jevon's Paradox, Peak Demand, Peak Everything, peak oil, vehicle miles traveled, Vmt, WTI
VMT (Vehicle Miles Traveled) up slightly in December relative to last December, but down overall for the year, and below its previous peak now for 49 months. With fuel prices on the rise it doesn’t look like it will break above that for quite some time — if ever.
But what do I know.. People are buying cars again. It’s Halftime in America and “the SUV is back.”
From the DOT:

Filed under: Uncategorized | Tags: consumption, DOT, energy, vehicle miles traveled, Vmt
Holy mackerel, vehicle miles driven continues to drop. Now 47 months and counting below the previous peak.
Feds’ numbers: http://www.fhwa.dot.gov/ohim/tvtw/11octtvt/index.cfm

click to enlarge
