


Filed under: Uncategorized | Tags: 2008, 2021, CO2, COVID, driving, emissions, energy demand, FHA, October 2021, oil consumption, pandemic, post-pandemic, trends, Vmt
United States, FHA. Cra-a-a-zy.

Filed under: Uncategorized | Tags: airlline fuel, energy, fuel costs, jet fuel, oil consumption, peak oil, transportation, Twitter
via the tweetbox
Airline fuel cost per gal: February dwn 0.7pct frm Jan, dwn 7.4pct frm Feb2013. At $3.02/gal #airlines #fuel #energy http://t.co/10KCH3ESM1
— TransportStats (@TransportStats) April 9, 2014
Filed under: Uncategorized | Tags: crude oil, demand, EIA, energy, energy use, gasoline, jet fuel, oil consumption, Peak Demand, peak oil, products supplied, US oil consumption
Via EIA Week in Review.
Total products supplied over the last four-week period averaged about 19.7 million barrels per day, up by 3.7 percent from the same period last year. Over the last four weeks, motor gasoline product supplied averaged over 9.0 million barrels per day, up by 3.3 percent from the same period last year. Distillate fuel product supplied averaged 4.0 million barrels per day over the last four weeks, up by 11.1 percent from the same period last year. Jet fuel product supplied is 1.6 percent higher over the last four weeks compared to the same four-week period last year.
Filed under: Uncategorized | Tags: baby boomers, driving, oil consumption, The Least Greatest Generation, transportatioin, Vmt
Meanwhile, The Least Greatest Generation drives more.
Indeed, young people don’t seem that interested in driving. Just 79 percent of people between 20 and 24 had a driver’s license in 2011, compared with 92 percent in 1983, according to the Michigan study.
Conversely, the oldest boomers are trooping down to the Department of Motor Vehicles in growing numbers to remain licensed to drive. Almost 93 percent of those age 60 to 64 had a driver’s license in 2011, up from 84 percent in 1983.
via Boomers Replace Their Children as No. 1 Market for Autos – Bloomberg.
Filed under: Uncategorized | Tags: energy, gas-electric, hev, hybrid, oil consumption, phev, Prius, transportation
Unimpressed with their cars’ performance and m.p.g. for the money. Still, hybrids are gaining popularity overall.
According to industry reports, only about one in three hybrid owners buy another gas-electric model when they trade in.
via Hybrid sales increase, but some eco-drivers are disappointed – Business on NBCNews.com.
Filed under: Uncategorized | Tags: carbon dioxide emissions, China, Chindia, climate, CO2, Econbrowser, James Hamilton, natural gas liquids, NGLs, oil consumption, Peak Demand, peak oil, total liquids, transportation

And it’s worth remembering why that happened– we didn’t have a choice. Global field production of crude oil (excluding natural gas liquids, which are not used as transportation fuel) stagnated at about 74 million barrels/day between 2005 and 2008. It is up a couple of million barrels since then, but more than 100% of this increase has been consumed by China alone, forcing the U.S. and other countries to reduce our oil consumption.
via James Hamilton: Econbrowser: Declining U.S. carbon dioxide emissions.
Filed under: Uncategorized | Tags: 2012, driving in the US, oil consumption, Peak Demand, Vmt
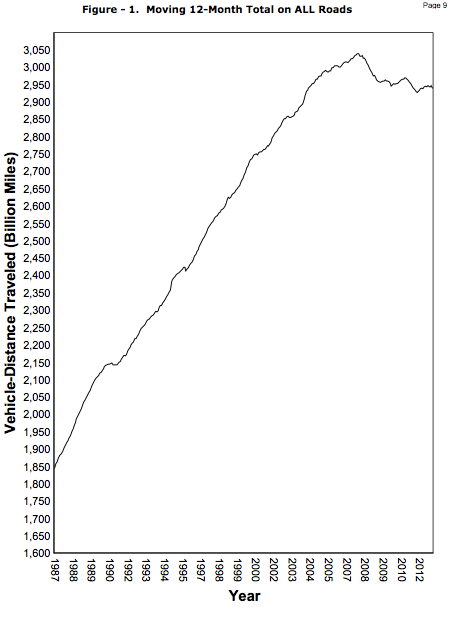
via http://www.fhwa.dot.gov/policyinformation/travel_monitoring/12dectvt/12dectvt.pdf
Filed under: Uncategorized | Tags: Bloomberg New Energy Finance, Business Council for Sustainable Energy, carbon dioxide, carbon emissions, CO2, CO2 production, oil consumption, renewable energy, US oil consumption, Vmt
Carbon dioxide emissions fell by 13% in the past five years, because of new energy-saving technologies and a doubling in the take-up of renewable energy, the report compiled by Bloomberg New Energy Finance (BNEF) for the Business Council for Sustainable Energy (BCSE) said.
via US carbon emissions fall to lowest levels since 1994 | Environment | guardian.co.uk.
Nah. It’s because we’re driving less. Look at the VMT chart. The drop in emissions is mainly due to the bad economy, not renewable energy.
Filed under: Uncategorized | Tags: FHWA, oil consumption, traffic volume trends, US oil consumption, US oil demand, vehicle miles traveled, Vmt
Filed under: Uncategorized | Tags: Bakken, crude oil, demand destruction, energy, fracking, IEA, KSA, mbd, oil consumption, oil production, Our Finite World, refinery gain, Saudi Arabia, Saudi Arabian oil production, shale gas, shale oil, tight gas, tight oil, Tvberg, Tverberg, unconventional oil, US oil production, WEO, World Energy Outlook
The happy talk on future production is crazier than ever in the latest IEA World Energy Outlook, but there are also some stunningly pessimistic predictions buried inside. Wild!
For instance: The US will become number one oil producuh again and rediscover our lost oil-producing prowess with about 11 million barrels/day (Yay!) — which must mean Saudi Arabia won’t approach IEA’s previous prediction for that country of roughly 15 mbd output (Ooof). And the predicted exporter status of the US (Yay!) relies as much on a huge drop in consumption as it does on increases in production (Ooof). So it’s a bit of a sad day in IEA land, where consumption always went up, up, up.
From Tverberg:
The International Energy Agency (IEA) provides unrealistically high oil forecasts in its new 2012 World Energy Outlook (WEO). It claims, among other things, that the United States will become the world’s largest oil producer by 2020, and will become a net oil exporter by 2030.

Figure 1. Author’s interpretation of IEA Forecast of Future US Oil Production under “New Policies” Scenario, based on information provided in IEA’s 2012 World Energy Outlook.
Figure 1 shows that this increase comes solely from the expected rise in tight oil production and natural gas liquids. The idea that we will become an exporter in later years occurs despite falling production, because “demand” will drop so much.
Note that IEA and other maniacs add NGLs, biodiesel and even ‘refinery gain’ to the US oil production number, in a crude attempt to fool y’all.
Filed under: Uncategorized | Tags: average mpg, cars, energy efficiency, fuel efficiency, gasoline consumption, mythology, oil consumption, peak oil, transportation, Vmt
via http://www.theoildrum.com/node/9542#more

The recent drop in oil consumption is not due to increases in fuel efficiency.
Filed under: Uncategorized | Tags: crude oil, demand growth, demand plateau, energy, OECD, oil consumption, oil demand, oil demand forecast, OPEC, Peak Demand, peak oil
Interesting times.
“Demand in the OECD is in structural decline and we’re not expecting that to change,” he said, adding that the IEA’s forecasts do take into account recent weaker economic activity in the Asia-Pacific region.
According to the report, which contains the IEA’s first forecasts for 2013, global oil demand will be 1.1% higher than 2012, averaging 90.9 million barrels a day.
The forecasts are more bullish than reports earlier this week from the U.S. Energy Information Administration and the Organization of Petroleum Exporting Countries, both of whom projected slower global oil demand growth in 2013 of 730,000 barrels a day and 800,000 barrels a day respectively.
via RIGZONE – IEA: 2013 Oil Demand Growth Higher On Muted Recovery.
Filed under: Uncategorized | Tags: austerity, economy, Ireland, Irish GDP, Krugman, oil consumption, Paul Krugman, the austerity fairy
In a graph, via Paul Krugman:
http://krugman.blogs.nytimes.com/2012/04/30/austerity-fantasies/?smid=tw-NytimesKrugman&seid=auto

Filed under: Uncategorized | Tags: Brent, energy demand, North Sea, oil consumption, oil demand, oil price predictions, peak oil, the breaking point, US oil demand
Via Stuart Staniford’s Early Warning:
http://earlywarn.blogspot.com/2012/04/us-oil-consumption-and-oil-prices.html

However, it’s also worth noting that the price required to make consumption decline has increased over time. In 2006-2007, prices of around $70 were enough to make oil consumption flatten and then decline. However, in late 2009 and 2010, similar prices obtained while consumption continued to rise. It took the rise to over $100 in spring 2011 to get consumption to start to decline again.
Filed under: Uncategorized | Tags: cars, DOT, dot gov, energy, FHWA, oil consumption, oil demand, Peak Demand, transportation, United States, vehicle miles traveled, Vmt
+ 1.8% Over Feb. 2011…
Moving 12-month total.
http://www.fhwa.dot.gov/policyinformation/travel_monitoring/12febtvt/12febtvt.pdf

Filed under: Uncategorized | Tags: Ali Naimi, energy, James Hamilton, oil consumption, oil demand, oil production, peak oil
“There is no rational reason for high oil prices,” writes Ali Naimi, Saudi Arabian Minister of Petroleum and Mineral Resources, in today’s Financial Times. Well, I can think of one– if oil prices were lower, the world would want to consume more than is currently being produced.
via Econbrowser: A rational reason for high oil prices.
Filed under: Uncategorized | Tags: energy, net available exports, oil consumption, oil exports, oil production, peak oil, Yemen
Via the EIA’s Yemen page, which seems to rely heavily on Oil & Gas Journal.

Filed under: Uncategorized | Tags: albatross, cash for clunkers, energy, February 2012 SAAR, light vehicle sales, oil consumption, peak oil, SAAR, transportation
via Rortybomb (who took the chart from Calculated Risk). MK is very excited about the auto numbers that came out today.
http://rortybomb.wordpress.com/2012/03/01/auto-sales-surpass-cash-for-clunkers-month/

Filed under: Uncategorized | Tags: Asia, China, Chindia, oil consumption, oil demand, oil imports, peak oil
via the Export Data Browser:

Filed under: Uncategorized | Tags: Canada, energy, fuel taxes, gas tax, gas taxes, gasoline, oil consumption, oil demand, transportation
In 2010, per liter.

click to enlarge
See also GAS TAXES IN DIFFERENT COUNTRIES
