


Filed under: Uncategorized | Tags: energy, Hormuz, Iran, oil, transportation, war
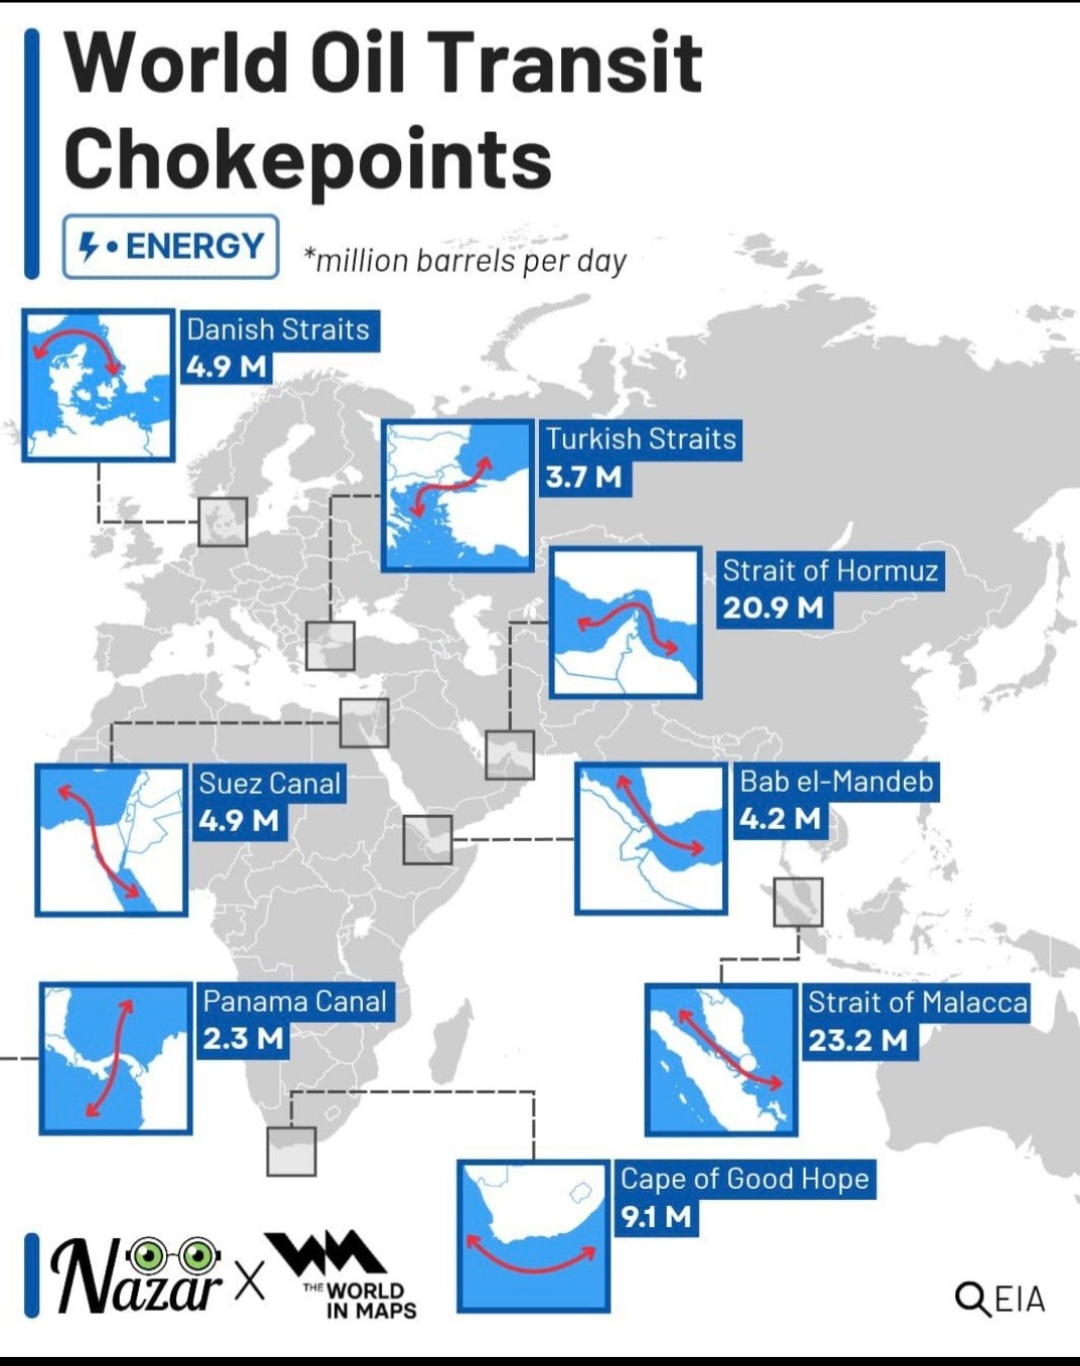
Strait of Malacca? I’m impressed.
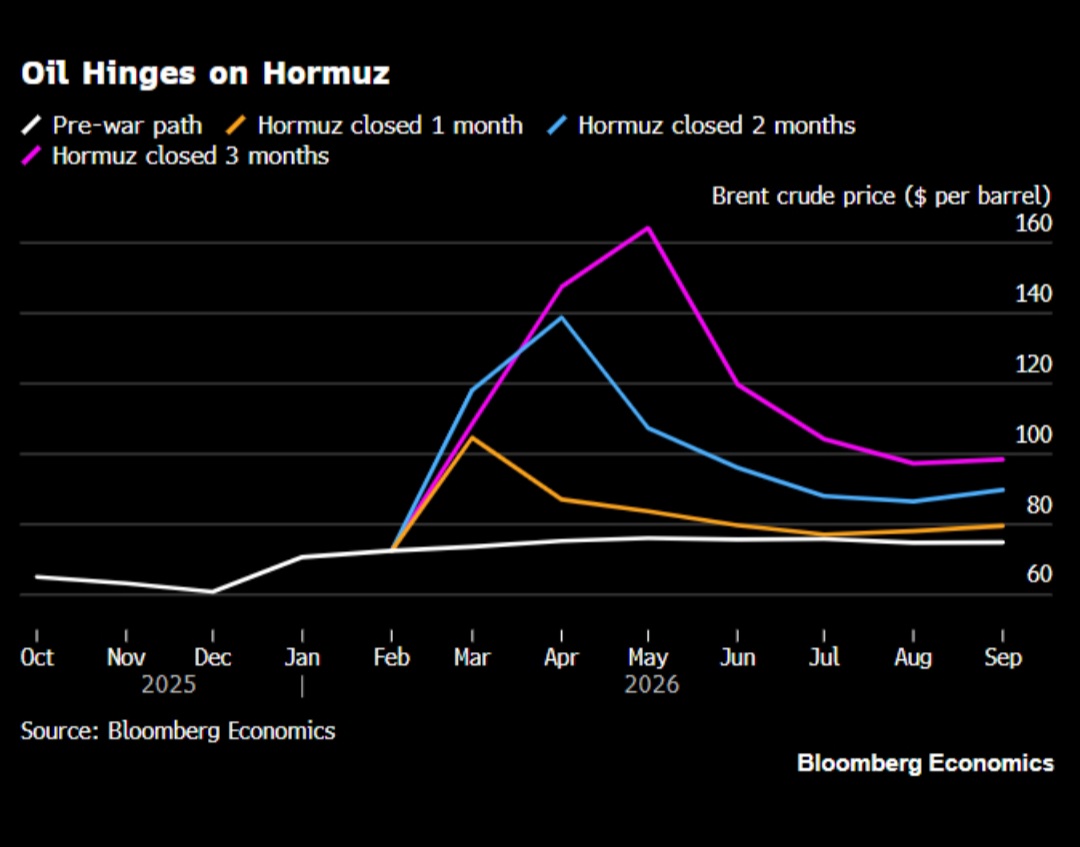
Filed under: Uncategorized, war | Tags: energy, Iran, oil production, Strait of Hormuz, transportation
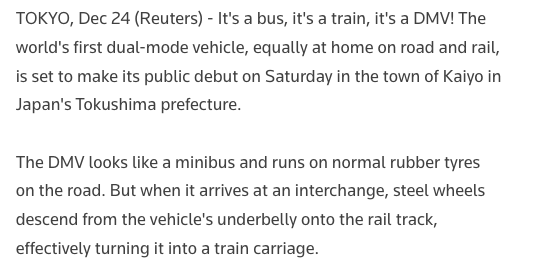
Filed under: Uncategorized | Tags: bus, DMV, dual-mode vehicle, Japan, public transit, rail, transportation
Looks like something that could have been invented in the 1890s (and probably was). Not high tech, but maybe that’s good. Maybe leaving tires on the train will make Americans more likely to use it. Put some sidepipes on it and a hood scoop.
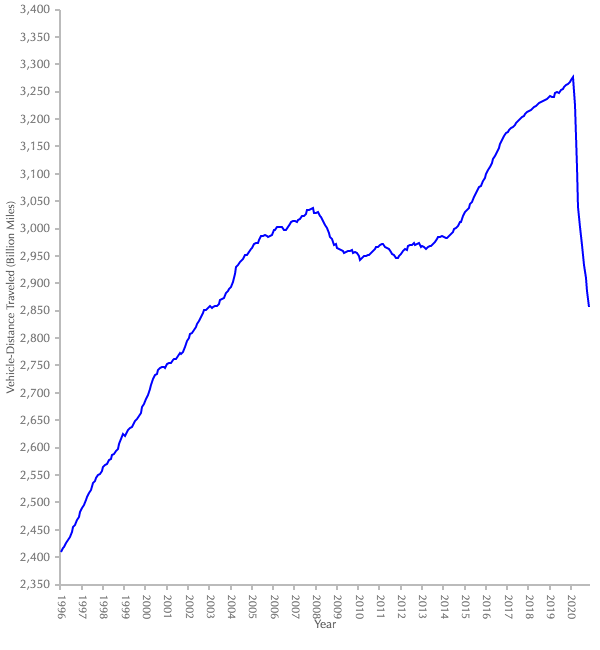
Filed under: Uncategorized | Tags: COVID-19, economy, FHWA, miles driven, pandemic, transportation, United States travel habits, vehicle miles traveled, Vmt, work from home, zoom
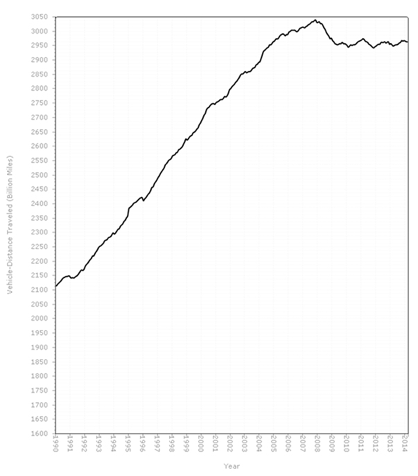
Revisiting Vehicle Miles Traveled after several years of looking away in absolute disgust. Below is the moving 12-month average, latest month recorded is November 2020.
https://www.fhwa.dot.gov/policyinformation/travel_monitoring/tvt.cfm
Filed under: Uncategorized | Tags: bicyclists, bike safety, bike share, bikeshare, biking, helmets, mineta transportation, transportation, urban cycling, urban transportation
Assumptions and facts, all mixed up.
Click to access 1204-bikesharing-and-bicycle-safety.pdf

Filed under: Uncategorized | Tags: Americans, climate change, driving, energy, energy consumption, gas prices, pollution, transportation, USA, vehicle miles traveled, Vmt
After a few years of sweet reversal of the VMT (Vehicle Miles Traveled) chart, then a few years of bouncing along what looked like a New Normal, things have turned around in a big way. Cheap gas being the primary culprit. Back to our old ways just like that, and making up for lost time.
http://www.fhwa.dot.gov/policyinformation/travel_monitoring/15augtvt/figure1.cfm

Filed under: Uncategorized | Tags: bicycle commuting, bike helmets, bike share, Capitol Hill, helmet dispensers, helmets, pronto, Seattle, transportation, urban cycling
People point to hills and weather as the biggest challenges facing bike share in Seattle. Wrong, it’s this:
In order for Pronto to operate in compliance with helmet laws, each station will also have a “helmet dispensing” device and a return bin. Helmets will be available to rent for $2, will be sanitized after each use, and cycled out after a certain number of uses. Expect to see more people walking around with their own bike helmets to beat the $2 fee.
Filed under: Uncategorized | Tags: border crossing, Canada, emigration, freight, immigration, Mexico, transportation
via US gov.
2013 Border Crossing/Entry Data | Bureau of Transportation Statistics.
Filed under: Uncategorized | Tags: bicycle accidents, bicycling, bike safety, biking, collisions, crash data, cycling, injuries, transportation
The following list of papers and links to papers or abstracts is from the Industrialized Cyclist Bicycling Research Page. Go to http//:www.industrializedcyclist.com/lies.html to click the links. The Research Page also has similar lists for international accident statistics, patterns of use, docs related to facilities and planning, cycling-related laws, helmets and more.
EVERY BICYCLIST COUNTS 2014 report from the League of American Bicyclists found 40% of cyclist fatalities the result of a hit-from-behind.
KAPLAN’S SURVEY OF L.A.W. MEMBERS Viet-Nam War-era cycling survey, 1974. Note: this is on the website of John Allen. Or download pdf.
ADULT BICYCLISTS IN THE UNITED STATES – CHARACTERISTICS AND RIDING EXPERIENCE IN 1996 (pdf) William Moritz’ survey of LAB members. An update of Kaplan with similar numbers. Are they good or bad? Depends on your perspective.
MORITZ’ INTERNET SURVEY OF BICYCLE COMMUTERS Another relatively robust survey from William Moritz, and very similar results.
THE CROSS STUDY This study of 384 accidents that occurred in Santa Barbara in the early 1970s has been cited in support of all kinds of claims. Should it be? Note: only on the website of John Forester.
CROSS-FISHER ’77 (pdf) Volume One of the landmark study prepared for the US Department of Transportation by Kenneth Cross and Gary Fisher. “A Study of Bicycle/Motor-Vehicle Accidents: Identification of Problem Types and Countermeasure Approaches,” vol. 1, September 1977.
BICYCLE ACCIDENTS AND USAGE AMONG YOUNG ADULTS This 1976 survey showed relatively alarming accident numbers for young riders. Note: on the website of John Forester.
CRASH TYPE MANUAL FOR CYCLISTS From the Federal Highway Administration, by Carol Tan, 1996.
NORTH CAROLINA BICYCLE AND PEDESTRIAN CRASH DATA TOOL. A database of all reported collisions in N.C. for ten years, includes age of victim, crash type, etc.
FHWA’S BIKE-PED PUBLICATION PAGE Facilities, education and more.
KEN KIFER’S 2001 BICYCLE SAFETY SURVEY A small survey of touring cyclists that seems to corroborate larger surveys of experienced riders, but finds strikingly bad news in the relative danger of cycling versus driving.
FLORIDA BICYCLIST AND PEDESTRIAN CRASH EXPOSURE (pdf) Based on 2002 phone survey.
IDAHO TRAFFIC CRASHES 2012 (pdf) Includes rudimentary information about bicycle crashes in the “Idaho Stop” state.
ON-ROAD BICYCLE FACILITIES AND BICYCLE CRASHES IN IOWA, 2007-2010 Abstract, July 2013, Accident Analysis and Prevention.
BICYCLE ACCIDENTS IN WASHINGTON STATE, 1988-1993 (pdf) A survey of police records by Ralph Wessels.
CALIFORNIA STATEWIDE SAFETY STUDY OF BICYCLES AND PEDESTRIANS ON FREEWAYS, EXPRESSWAYS, TOLL BRIDGES, AND TUNNELS 2001 report by Ferrara, San Jose State University.
MANNER AND FAULT IN BICYCLIST FATALITIES : ARIZONA 2009 (pdf) Small sample size.
BICYCLIST FATALITIES AND SERIOUS INJURIES IN NEW YORK CITY 1996-2005 (pdf) Collaboration of local government agencies.
“ONLY GOOD CYCLIST” (pdf) Study of NYC police reports by Right of Way group concludes motorists are more often at fault in car-bike collisions. See also “KILLED BY AUTOMOBILE,” (pdf) 1999 report from Right of Way organization on pedestrian and bicyclist fatalities in NYC 1994-1997.
“ON ‘DOORINGS’ OF BICYCLISTS …” Article by Al Baker on New York Times’ City Room blog, October 28, 2010, includes some figures on numbers of doorings in New York state, and information on applicable laws.
BOSTON EMS BIKE CRASH DATA MAP Shows EMS responses to bike accidents in city of Boston, one year, October 31, 2009 to October 31, 2010.
OCCUPATIONAL INJURIES AMONG BOSTON MESSENGERS Harvard researcher J. Dennerlein presents a non-robust 2002 survey that focuses on the danger of messenger work, but with data that (inadvertently, and unknown to prof. Dennerlein) confirms veteran messengers carry accident rates better than those found in the major surveys of club cyclists.
BICYCLE-MOTOR VEHICLE ACCIDENTS IN METROPOLITAN BOSTON 1979-80 On John Allen’s site. This old study by the Metropolitan Area Planning Council is based on a sampling of reported collisions, and confirms a profound correlation of age with accident type.
CITY OF BOISE CYCLING SAFETY TASK FORCE FINAL REPORT (pdf) 2009 report contains crash statistics for previous five years, recommends continuing ‘Idaho Stop’ law.
SAFE STREETS BOULDER 2012 (pdf) A study of motor vehicle accidents involving bicycles and pedestrians, study period 2008-2011. From the City of Boulder. See Robert Hurst’s thoughts on this study here: BOULDER STREETS SAFE?
BICYCLE ACCIDENTS IN FORT COLLINS, COLORADO 2000-2009 (pdf) Survey of reported accidents appears to show accident and injury rates on the rise.
CITY OF MADISON, WISCONSIN 2010 CRASH REPORT (pdf).
MESA ARIZONA BIKE-CAR WRECK STUDY (pdf) Study of police reports from all reported accidents in Mesa, Arizona in 2005.
THE OHSU PORTLAND, OREGON BICYCLIST INJURY SURVEY (pdf) Published in Trauma, November, 2010. Introduces a rather expansive definition of “traumatic event.”
SEATTLE INTERACTIVE BICYCLE ACCIDENT MAP 2011 From the Seattle Times.
SAN FRANCISCO BIKE ACCIDENT DATABASE 2010 The Bay Citizen.
FATALITY ANALYSIS REPORTING SYSTEM (FARS) Seductive numbers of dubious utility. People want to draw conclusions from the annual fatality numbers, but the conclusions don’t necessarily follow. See also: FARS PEDALCYCLIST PAGE. See also this article by Robert Hurst commenting on the different fatality numbers provided by the FARS and WISQARS databases.
ROAD FATALITIES USA Map of US road deaths for all users, from FARS database, 2001-2009. Zoom-in-outable.
BICYCLIST DEATHS AND FATALITY RISK PATTERNS Abstract, Gregory Rodgers, Accident Analysis and Prevention, April 1995.
INSURANCE INSTITUTE FOR HIGHWAY SAFETY’S BICYCLE FATALITY ANALYSIS PAGE Meta-analysis of FARS data.
THE NEISS HOME PAGE CPSC’S National Electronic Injury Surveillance System (NEISS), the best injury data available. See also THE NEISS CODING MANUAL (pdf).
WISQARS (WEB-BASED INJURY STATISTICS QUERY AND REPORTING SYSTEM) Uses NEISS data. See also this article by Robert Hurst commenting on the different fatality numbers provided by the FARS and WISQARS databases.
CYCLISTS INJURED WHILE SHARING THE ROAD WITH MOTOR VEHICLES Abstract of 2007 article by Haileyesus, et al in Injury Prevention. Analysis of NEISS data shows car-bike crashes are involved in only about 15% of all cyclist ER visits.
RISK FACTORS FOR BICYCLE-MOTOR VEHICLE COLLISIONS AT INTERSECTIONS By Alan Wachtel and Diana Lewiston. A look at reported collisions from the late 1980s in Palo Alto, California, crossed with exposure data provided by the city. On Bicyclinglife.
INJURY SEVERITY IN BICYCLE-MOTOR VEHICLE CRASHES Abstract of 2006 article using police-reported data from North Carolina.
BICYCLE-RELATED INJURIES 2001 article by Thompson and Rivara in American Family Physician.
PEDIATRIC HOSPITALIZATIONS FOR BICYCLE-RELATED INJURIES Abstract of 2007 article from Injury Prevention.
THE OHIO BICYCLE INJURY STUDY Abstract of 1995 paper examining 52 hospital admissions of child cyclists in Ohio.
CPSC’S BICYCLE USE AND HAZARD PATTERNS IN THE UNITED STATES (pdf) One of the most … questionable documents on the list. See also Dr. Gregory Rodgers’ informative DEFENSE OF THE CPSC STUDY against John Allen.
2010 NHTSA BICYCLISTS AND OTHER CYCLISTS FACT SHEET (pdf) / 2008 NHTSA BICYCLISTS AND OTHER CYCLISTS FACT SHEET (pdf) / 2007 NHTSA PEDALCYCLIST FACT SHEET (UPDATED) (pdf) / 2007 NHTSA PEDALCYCLIST FACT SHEET (pdf) / 2004 NHTSA PEDALCYCLIST FACT SHEET (pdf) / 2001 NHTSA PEDALCYCLIST FACT SHEET (pdf) / 1998 NHTSA PEDALCYCLIST FACT SHEET (pdf) / 1993 NHTSA PEDALCYCLIST FACT SHEET (pdf) Beware of ‘Fact Sheets,’ especially when they contradict other ‘Fact Sheets’ produced by the same agency.
2005 MOTOR VEHICLE TRAFFIC CRASH FATALITY COUNTS AND INJURY ESTIMATES (pdf) NHTSA estimates show marked increase in injuries to non-occupants in 2005.
INCIDENCE OF PEDESTRIAN AND BICYCLIST CRASHES BY HYBRID ELECTRIC VEHICLES (pdf) 2009 NCSA report.
INJURY TO PEDESTRIANS AND BICYCLISTS (pdf) FHWA analysis based on data from a handful of emergency rooms. Data collected ’95-’96.
NHTSA PEDESTRIAN CRASH REPORT (pdf) Updated through 2006, report released 2008. See also PEDESTRIAN ROADWAY FATALITIES (pdf) 2003 NHTSA report. Neither report mentions bike-ped collisions.
SAFETY IN NUMBERS: MORE WALKERS AND BICYCLISTS, SAFER WALKING AND BICYCLING Abstract of 2003 paper by Jacobsen. This paper merits a special chapter in THE CYCLIST’S MANIFESTO.
THE CONTINUING DEBATE ABOUT SAFETY IN NUMBERS (pdf) 2006 paper from the UC Berkeley Traffic Safety Center examines the theory with respect to pedestrian data from Oakland, finds a relationship.
THE IMPACT OF TRANSPORTATION INFRASTRUCTURE ON BICYCLING INJURIES AND CRASHES: A REVIEW OF THE LITERATURE 2009 meta-analysis of 23 papers, in Environmental Health. See also FACILITIES AND PLANNING below.
USE OF ALCOHOL AS A RISK FACTOR FOR BICYCLING INJURY 2001 article on the JAMA site.
ALCOHOL, BICYCLING AND HEAD AND BRAIN INJURY: A STUDY OF IMPAIRED CYCLISTS’ RIDING PATTERNS (Abstract) Analysis of 200 patients processed through a regional trauma center in Austin, Texas.
ACCIDENT ANALYSIS AND PREVENTION Free abstracts and tables of contents for this important journal.
A GUIDE FOR REDUCING COLLISIONS INVOLVING BICYCLES 2008 report by Transportation Research Board from analysis of several data sets. View pdf via TRB website.
Filed under: Uncategorized | Tags: demographics, driving, miles traveled, miles traveled graph, Peak Driving, peak oil, transportation, travel, Vmt
Continuation of recent trend suggesting American driving may have peaked.
http://www.fhwa.dot.gov/policyinformation/travel_monitoring/14martvt/figure1.cfm
Filed under: Uncategorized | Tags: airlline fuel, energy, fuel costs, jet fuel, oil consumption, peak oil, transportation, Twitter
via the tweetbox
Airline fuel cost per gal: February dwn 0.7pct frm Jan, dwn 7.4pct frm Feb2013. At $3.02/gal #airlines #fuel #energy http://t.co/10KCH3ESM1
— TransportStats (@TransportStats) April 9, 2014
Filed under: Uncategorized | Tags: Alta Bikeshare, Alta Planning, bikeshare, Marie Casista, Portland, toronto, transportation
Why does my “Spidey Sense” activate every time I hear something about Alta? Something going on there…
The program will simply be called “Bike Share Toronto” and will be operated daily by Alta Bicycle Share , a Portland, Oregon-based company operating bike share systems in New York, Chicago, Boston and Melbourne, Australia.
The new logo will look almost identical to Toronto Parking logos except with a bike instead of a green P, said Marie Casista, vice-president of real estate, development and marketing for TPA.
“(The name) really represents what it is,” Casista said, “and what we’re doing.”
The beleaguered urban cycling program, which started in 2011, has struggled financially, telling the city last year it could no longer make payments on a $3.9-million city loan.
In December, Bixi’s creator Quebec-based Public Bike System Company and the city came to a deal to transfer all Toronto assets , with TPA set to run the program as of April 1. In January, the Public Bike System Company filed for bankruptcy protection.
via New name, look and prices for Toronto’s Bixi | Toronto Star.
Filed under: Uncategorized | Tags: accident rates, casualties, casualty rates, cycling, drivers, London, pedestrians, road users, transportation, Twitter, UK, urban cycling
Casualty rate and total number of casualties in London by road user type and age from http://t.co/U57gv7Hm8G pic.twitter.com/yf4vz2fXzG
— Jim (@geographyjim) March 20, 2014
Filed under: Uncategorized | Tags: begrimed, begrimers, bike share, bikewhare, Citibike, New York, NYU, transportation, urban cycling
Citibike, that is.
A new study out of NYU: http://wagner.nyu.edu/rudincenter/wp-content/uploads/2014/03/CitiBikeTakesNewYork_.pdf
Citi Bike has become a vital element of the city’s transportation network, providing a new flexible mode for many New Yorkers. Trips that were once 20-minute walks are now 5-minute bike rides, and places previously inacces- sible by public transit are now linked to the network.
In its first six months of operation, Citi Bike riders took more than 6 million trips, and by early January, nearly 100,000 riders spent $95 to become annual members.
Bikeshare proven now to be among the safest forms of transport.
Filed under: Uncategorized | Tags: bike share, Bixi, cycling, Montreal, transportation, urban cycling
Somebody tell me what to think about this.
Bixi owes the city $31.6 million on a $37-million city loan. Montreal also guaranteed a line of credit on which Bixi owes $6.4 million.That means Montreal taxpayers could be stuck with a $38-million bill, though the city hopes a sale of the international part of the business will cut that amount.Bixi also owes its suppliers $9 million.In total, then, Bixis total debt is at least $47 million.Bixi is also embroiled in multimillion-dollar lawsuits with a former software supplier.
via Bixi files for bankruptcy protection.
Filed under: Uncategorized | Tags: Andrew Restuccia, energy, fracking, oil imports, peak oil, Politico, transportation, US oil imports, US oil production
Attention news reporters, editors, producers and quacking heads: The US burns about 18.5 million barrels per day, and produces 7.7.
18.5 – 7.7 is 10.8.
These numbers are from the freakin EIA itself: http://www.eia.gov/petroleum/supply/weekly/pdf/table1.pdf
No wonder the Koreans are kicking our tails in math. We get reports like this, all over the internet and on NPR:
In October, for the first time since February 1995, the U.S. produced more crude oil than it imported, the Energy Information Administration said this week.
EIA, the Energy Department’s nonpartisan statistical arm, said U.S. crude oil production averaged 7.7 million barrels per day in October while 7.6 million barrels per day were imported.
via U.S. oil output tops imports for first time since 1995 – Andrew Restuccia – POLITICO.com.
Even if that were true, all it would mean is that we still have to import half the oil we burn. But we’re not there yet, and may never be (again).
Filed under: Uncategorized | Tags: bicycling, bike lanes, biking, Complete Streets, cycling infrastructure, NACTO, transportation, urban cycling
Urban Street Design Guide | NACTO.

Filed under: Uncategorized | Tags: Air pollution, black carbon, dirt clod, energy, industrial emissions, ozone, ozone concentrations, particulate, PM-2.5, tailpipe, transportation
Via MIT. Looking at 2005:
… Total combustion emissions in the U.S. account for about 200,000 (90% CI: 90,000–362,000) premature deaths per year in the U.S. due to changes in PM2.5 concentrations, and about 10,000 (90% CI: −1000 to 21,000) deaths due to changes in ozone concentrations. The largest contributors for both pollutant-related mortalities are road transportation, causing ∼53,000 (90% CI: 24,000–95,000) PM2.5-related deaths and ∼5000 (90% CI: −900 to 11,000) ozone-related early deaths per year, and power generation, causing ∼52,000 (90% CI: 23,000–94,000) PM2.5-related and ∼2000 (90% CI: −300 to 4000) ozone-related premature mortalities per year. Industrial emissions contribute to ∼41,000 (90% CI: 18,000–74,000) early deaths from PM2.5 and ∼2000 (90% CI: 0–4000) early deaths from ozone. The results are indicative of the extent to which policy measures could be undertaken in order to mitigate the impact of specific emissions from different sectors — in particular black carbon emissions from road transportation and sulfur dioxide emissions from power generation.
Filed under: Uncategorized | Tags: butane, energy, gas prices, gasoline, NGLs, RVP, transportation, vapor pressure
Blending butane into gasoline is why gas prices fall in the fall, according to Robert Rapier. RVP = Reid vapor pressure, the higher the RVP the faster the evaporation. EPA sets limits on RVP of gasoline which are more stringent in summer months than in winter, allowing the increased blending of cheap, yet highly evaporative (word?) butane:
Butane has an RVP of 52 psi, which means pure butane is a gas at normal pressures and temperatures. But butane can be blended into gasoline, and its fractional contribution to the blend roughly determines its fractional contribution to the overall vapor pressure of the mixture. As long as the vapor pressure of the total blend does not exceed normal atmospheric pressure (again, ~14.7 psi) then butane can exist as a liquid component in a gasoline blend.
But with a vapor pressure as high as 52 psi, butane can’t make a large contribution to summer blends where the vapor pressure limit is 7.8 psi. For example, if a gasoline blend contained 10 percent butane, butane’s contribution to the vapor pressure limit is already 5.2 psi and you would still have 90 percent of the blend to go. It isn’t feasible to blend much butane into gasoline when the vapor pressure requirement is low. But when the limit increases by 5 or 7 psi, it becomes feasible to blend large quantities of butane.
Why do we care about blending butane anyway? Because it is abundant and cheap. Butane can routinely trade at a $1/gallon discount to crude oil or gasoline. Butane is a byproduct of oil refining, but is also a component of natural gas liquids (NGLs), which are condensed out during natural gas production. Given the huge expansion of natural gas production in the US, it should come as no surprise that NGL production is also on the rise.
via Why Gasoline Prices are Falling.
Filed under: Uncategorized | Tags: Colorado, driving, energy, gasoline consumption, Great Recession, transportation, Vmt
Just like everywhere else…
DENVER – A new report from the Colorado Public Interest Research Foundations shows Coloradans have cut their per-person driving miles by 11.4 percent since 2005.
via Report: Double-digit drop in driving in Colorado | 9news.com.
Since 2005. But is it headed back up compared to last year?
