


In 2020, Traffic fatalities up, while VMT down
March 6, 2021, 21:01
Filed under: Uncategorized | Tags: 2020, driving, fatalities per mile traveled, fatality rate, motoring, NHTSA, nsc, traffic fatalities, US transportation, vehicle miles traveled
Filed under: Uncategorized | Tags: 2020, driving, fatalities per mile traveled, fatality rate, motoring, NHTSA, nsc, traffic fatalities, US transportation, vehicle miles traveled
That’s strikingly bad. Total fatalities up 8% over 2019, while fatality rate per vmt rose 24% by one estimate.
Source: Driving Was Down In 2020, But Traffic Fatality Rates Surged : NPR
Leave a comment
Could be ‘just one of those things’
December 13, 2012, 19:18
Filed under: Uncategorized | Tags: 2011, bicycling, cyclist fatalities, cyclist injuries, FARS, NHTSA, traffic accidents, urban cycling
Filed under: Uncategorized | Tags: 2011, bicycling, cyclist fatalities, cyclist injuries, FARS, NHTSA, traffic accidents, urban cycling
Significantly more bicyclists killed in car-bike crashes, significantly fewer injured in car-bike crashes… Does this make some kind of sense?
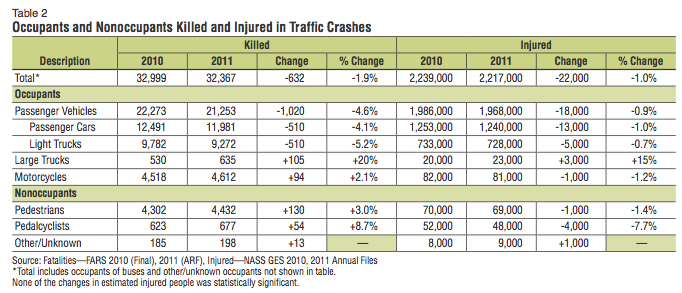
click to enlarge
via NHTSA 2011 Motor Vehicle Crashes Overview (pdf): http://www-nrd.nhtsa.dot.gov/Pubs/811701.pdf
Demographics of the bicycling population
December 12, 2012, 10:55
Filed under: Uncategorized | Tags: 2010 fatalities, cyclist fatalities, fact sheet, FARS, gov pubs, NHTSA, traffic deaths, transportation
Filed under: Uncategorized | Tags: 2010 fatalities, cyclist fatalities, fact sheet, FARS, gov pubs, NHTSA, traffic deaths, transportation
Take this back to 1970 and you would see a far more extreme change.
The decline of child cycling is the most important story in American cycling, rears its ugly head in data like this.
via NHTSA Bicyclists and Other Cyclists Fact Sheet 2010 (pdf): http://www-nrd.nhtsa.dot.gov/Pubs/811624.pdf

