


Filed under: Uncategorized | Tags: COVID-19, economy, FHWA, miles driven, pandemic, transportation, United States travel habits, vehicle miles traveled, Vmt, work from home, zoom
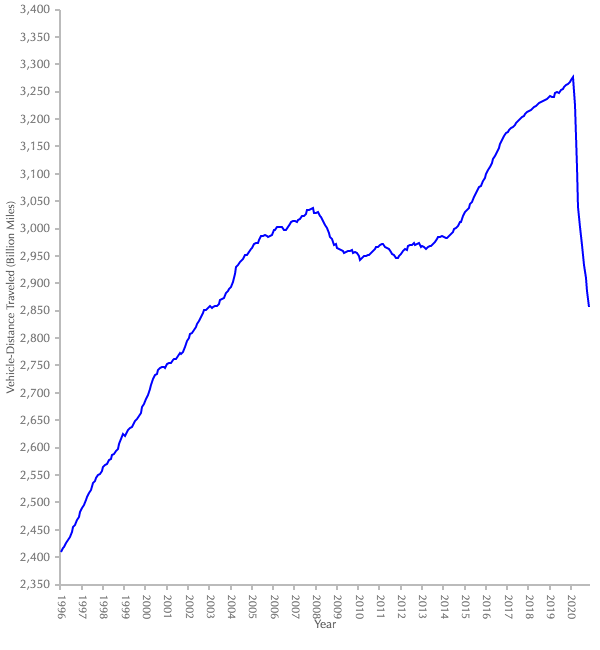
Revisiting Vehicle Miles Traveled after several years of looking away in absolute disgust. Below is the moving 12-month average, latest month recorded is November 2020.
https://www.fhwa.dot.gov/policyinformation/travel_monitoring/tvt.cfm
Filed under: Uncategorized | Tags: does this make sense, FHWA, say huh, vehicle miles traveled, Vmt, x axis
Notice anything weird about this VMT chart (other than its unusual downward trend that is)? I never noticed it before..
via http://www.fhwa.dot.gov/policyinformation/travel_monitoring/13jantvt/index.cfm

[Mexico vs. USA en vivo ahora..]
Filed under: Uncategorized | Tags: FHWA, oil consumption, traffic volume trends, US oil consumption, US oil demand, vehicle miles traveled, Vmt
Filed under: Uncategorized | Tags: cars, DOT, dot gov, energy, FHWA, oil consumption, oil demand, Peak Demand, transportation, United States, vehicle miles traveled, Vmt
+ 1.8% Over Feb. 2011…
Moving 12-month total.
http://www.fhwa.dot.gov/policyinformation/travel_monitoring/12febtvt/12febtvt.pdf

Filed under: Uncategorized | Tags: centerline, centerline miles, FHWA, highway infrastructure, highways, transportation, What the Florida, WTF
And the western states don’t.
Via http://www.fhwa.dot.gov/policyinformation/pubs/hf/pl11028/chapter1.cfm
Figure 1-7: Toll Road, Bridges, and Tunnels Centerline Miles by State: 2009

