


Filed under: Uncategorized | Tags: deregulation, electricity, energy, energy grid, Enron, fossil fuels, Green New Deal, Greg Abbott, Hannity, Natural gas, power generation, power grid, Texas, texas governor, Texas power outages, wind turbines, winterization of power grid
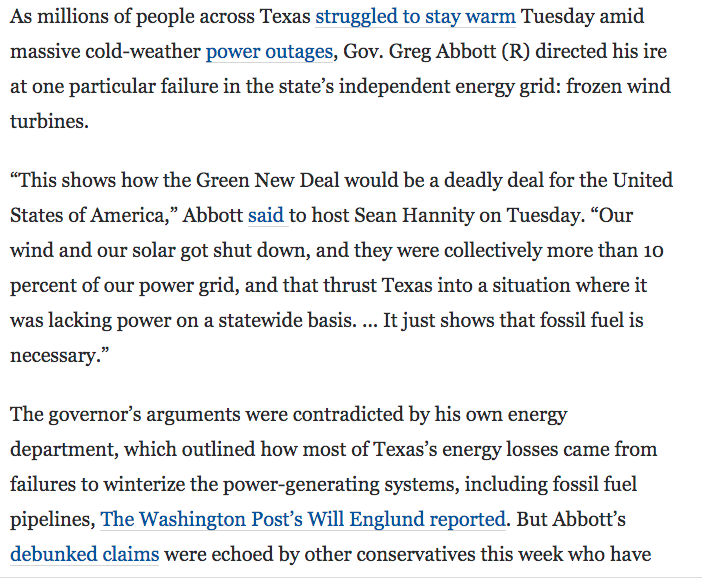
…says the failure of renewable energy caused the emergency and that this shows the Green New Deal would be a disaster. He did not actually blame the outages on the Green New Deal as many have said. But he was shoveling pretty hard nonetheless.
Katie Shepherd, Wash Post Feb 17 https://www.washingtonpost.com/nation/2021/02/17/texas-abbott-wind-turbines-outages/
blah blah
Filed under: Uncategorized | Tags: Destination Cities, employment, fracking, Houston, National Migration Trend Report, peak oil, Texas, U-Haul, unemployment
…
PHOENIX (April 12, 2013) — U-Haul International, Inc., today released the results of the annual 2012 U-Haul National Migration Trend Report, titled “The U-Haul 2012 Top 50 U.S. Destination Cities.” According to moving data reflective of nationwide statistics for calendar year 2012, families moving to Houston took the No. 1 spot again, for the fourth year in a row.
via U-Haul: About: U-Haul Names Houston as Top 2012 U.S. Destination City.
Filed under: Uncategorized | Tags: ASPO, crude oil production, EIA, energy, Jeffrey Brown, oil production propaganda, peak oil, production numbers, Railroad Commission of Texas, RRC, Texas, Texas crude oil production, transportation
According to the Railroad Commission of Texas.
http://www.rrc.state.tx.us/data/production/oilwellcounts.php
Some individuals recently noting the difference between RRC and EIA production numbers. From a comment by Jeffrey Brown:
Total US Crude Oil Production (EIA, mbpd):
2002: 5.746
2003: 5.681
2004: 5.419
2005: 5.178
2006: 5.102
2007: 5.064
2008: 4.950
2009: 5.361
2010: 5.476
2011: 5.662Total US Crude Oil Production, using RRC data for Texas, instead of EIA (Gap Between the two data sets):
2002: 5.615 (+131,000 bpd)
2003: 5.548 (+133,000)
2004: 5.303 (+116,000)
2005: 5.059 (+119,000)
2006: 4.948 (+154,000)
2007: 4.898 (+166,000)
2008: 4.813 (+137,000)
2009: 5.199 (+162,000)
2010: 5.285 (+194,000)
2011: 5.324 (+338,000)
http://www.theoildrum.com/node/9191#comment-893345
Filed under: maps, Uncategorized | Tags: Eagle Ford shale, frac, oil, oil shale, shale gas, shale oil, Texas, tight gas, tight oil, tracking, water
http://online.wsj.com/article/SB10001424052970204528204577009930222847246.html
Piece in WSJ on oil versus water in Texas. The inconvenient reality of hydro-fracking. The article itself claims 6 million gallons needed for each Frac in the Eagle Ford. (The article is behind the paywall.)

