


Filed under: maps | Tags: England, imperialism, invasions, terrorism, world maps
Countries never invaded by England (all 22 of them..) pic.twitter.com/BUC1qrPg6y
— ian bremmer (@ianbremmer) February 15, 2014
Filed under: maps | Tags: energy, lean energy, renewable energy, United States maps, USGS, wind energy, wind turbine map, wind turbines
USGS Releases First-Ever National Wind Turbine Map & Database > USGS Energy Resources Program.

This is just a screen shot, click link above to visit interactive map.
Filed under: maps | Tags: beats, Dean Moriarty, denver, Five Points, Ginsberg, hitchhiking, Jazz, Kerouac, Neal Cassidy, on the road
…before he went back to Denver to steal cars with Neal Cassidy.

Filed under: maps | Tags: bicycle mode share, bicycling, bike counters, bike counts, ridership, Seattle, share, urban cycling
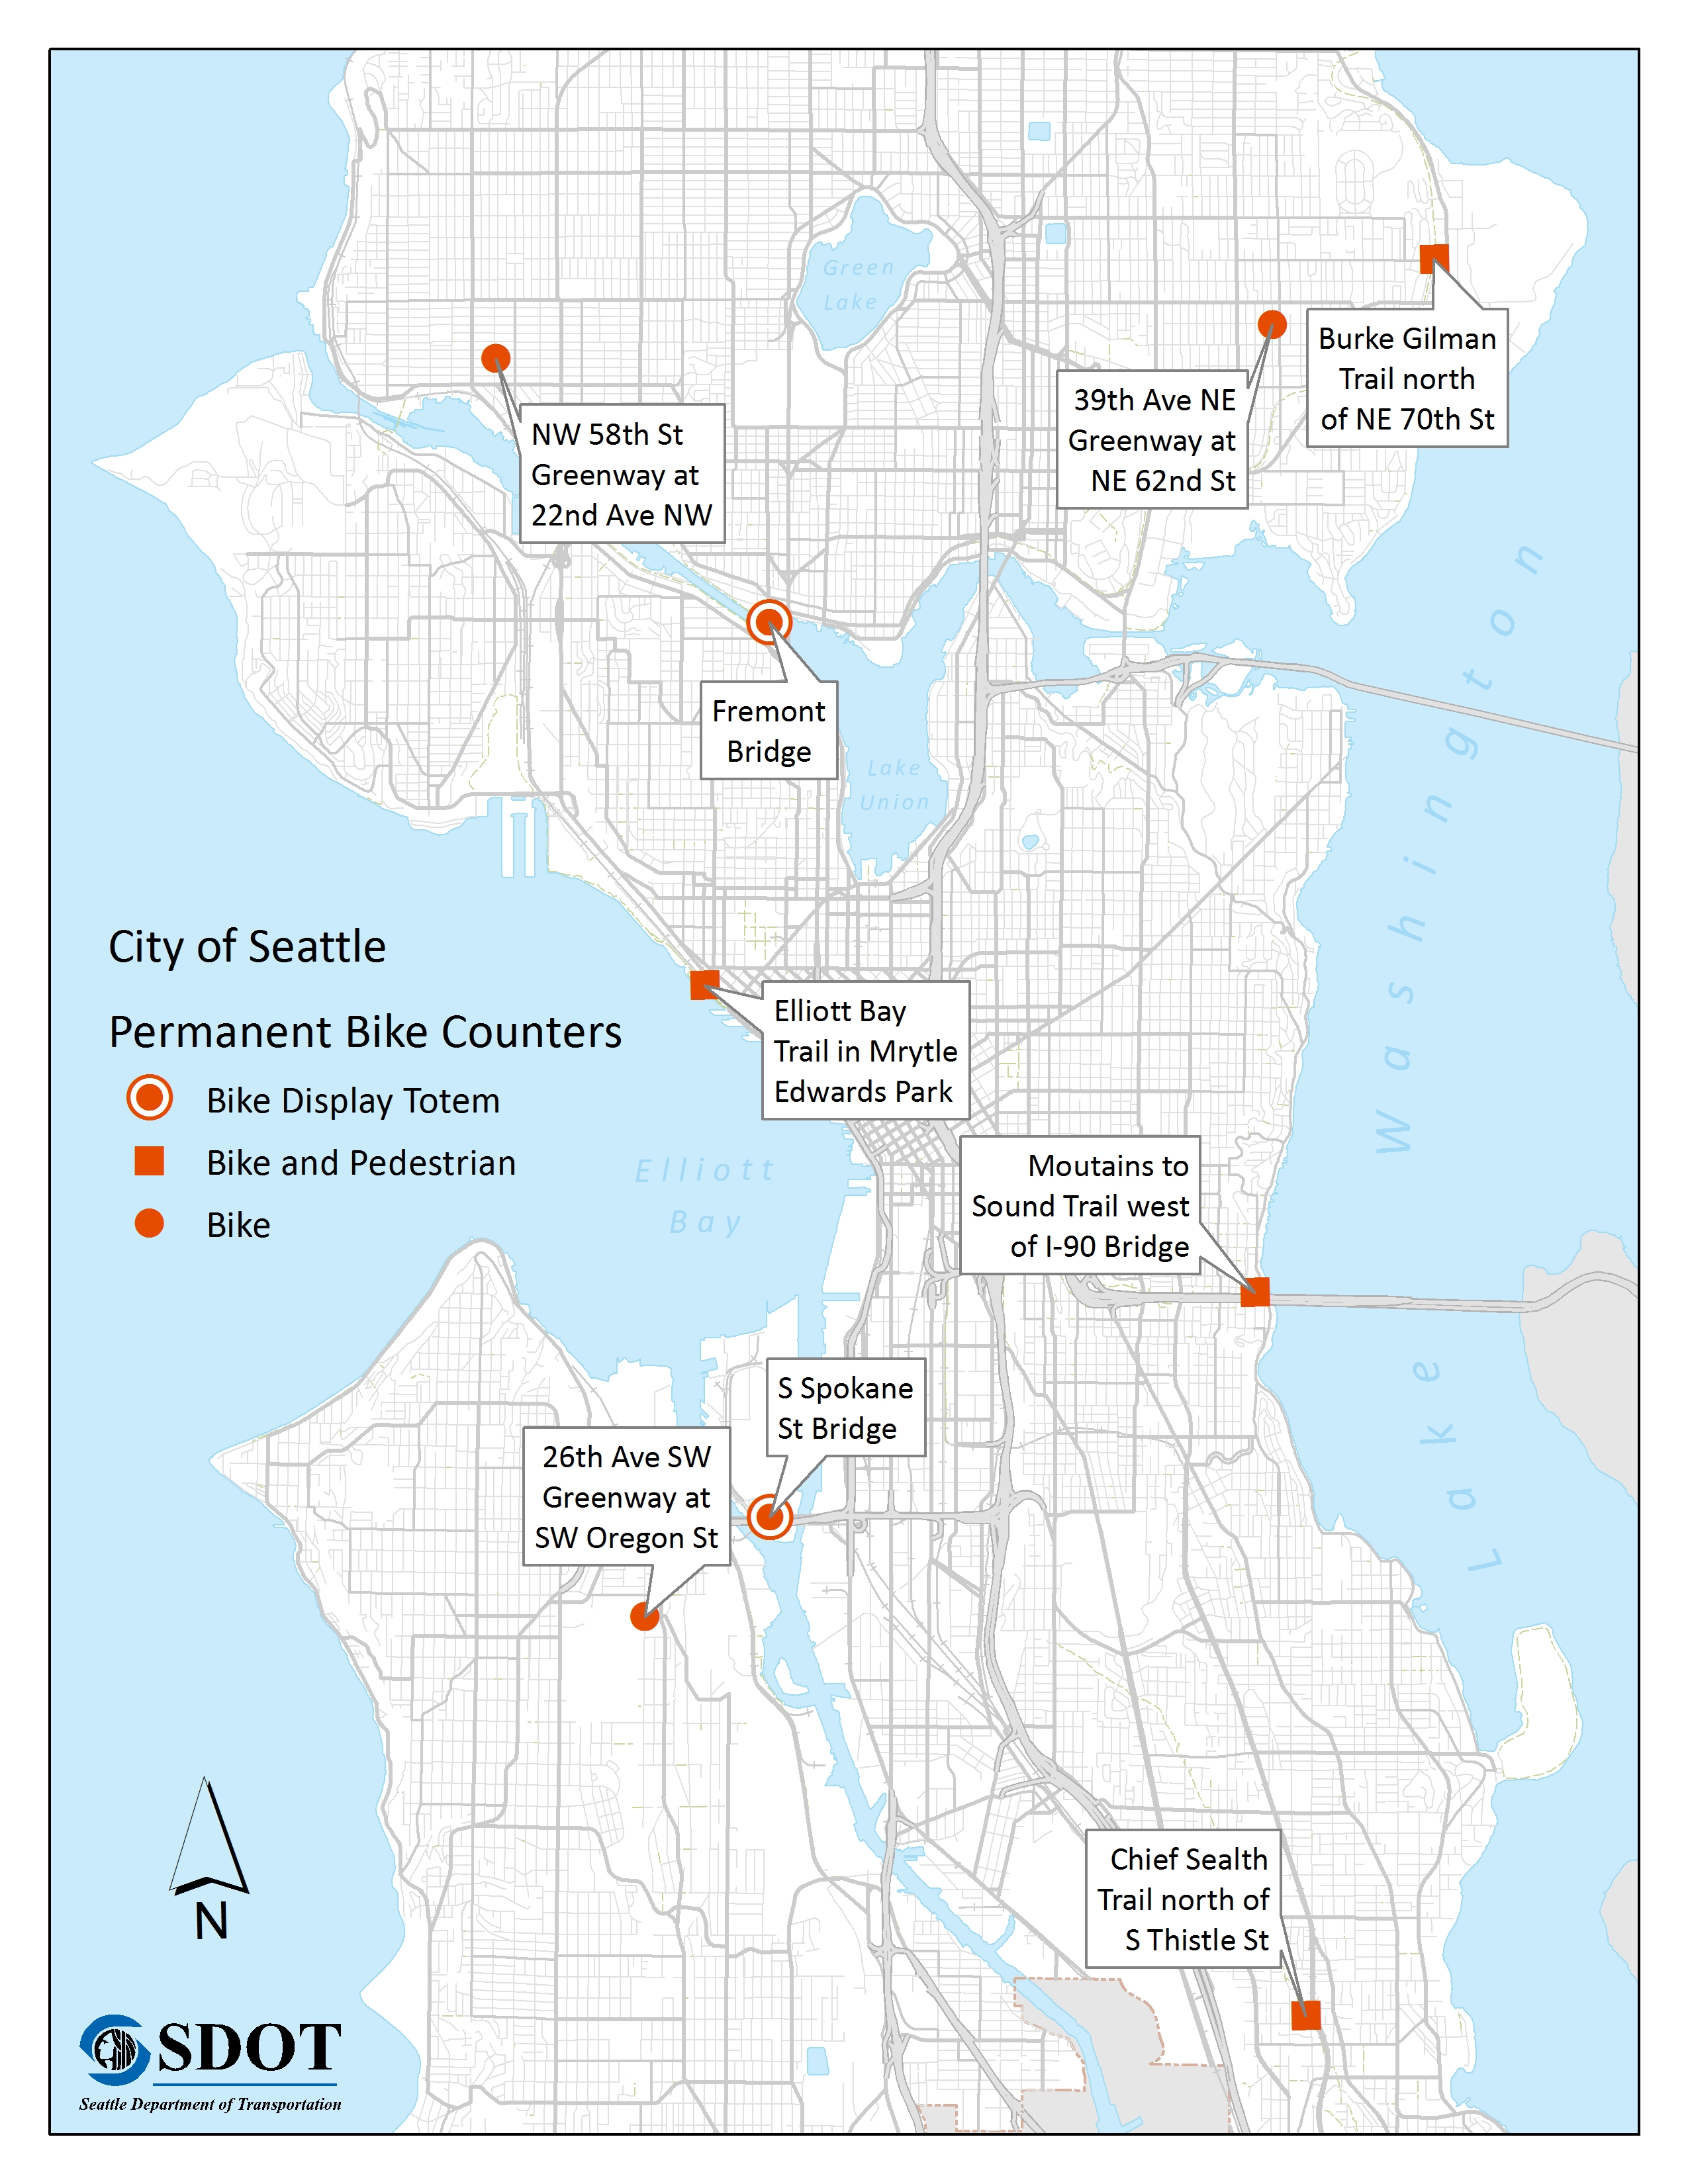
click to enlarge
You no longer have to bike all the way to Fremont to get counted. The city — with support from the Rails to Trails Conservancy and the Mark and Susan Torrance Foundation — has installed seven new real-time bike counters around the city. This brings the city’s total to nine.
via Real-time bike counters now installed in 9 locations around the city | Seattle Bike Blog.
Filed under: maps, Uncategorized | Tags: bicycling, cycling, GPS tracks, Strava

click to enlarge
PDF: http://www.tfl.gov.uk/assets/downloads/roadusers/central-london-grid-map.pdf

Filed under: maps | Tags: Indianapolis, Joan Hostetler, transportation, urban cycling, urban development, urban freeways
In Indianapolis and elsewhere. Here is a current map of some Indy freeways superimposed over a 1956 aerial photo.
 click to enlarge
Filed under: maps, Uncategorized | Tags: coaches, economy, government, public employees, USA #1, WTF
Sad-larious.

click to enlarge
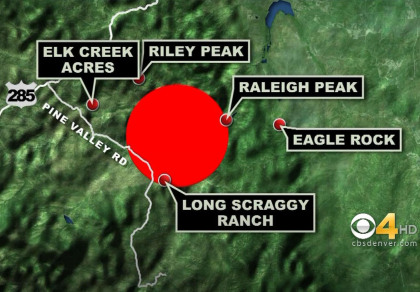
Filed under: maps | Tags: buffalo creek, forest fire map, forest fires, Gabbert, lime gulch, Lime Gulch Fire, USGS
Lime Gulch is the name of the latest Buff Creek fire. Funny thing, there is no Lime Gulch around there apparently.
Map via USGS via Bill Gabbert:
http://wildfiretoday.com/2013/06/19/lime-rock-fire-causing-evacuations-southwest-of-denver/

Filed under: maps, Uncategorized | Tags: buffalo creek, Chair Rock, fire, forest fire, Foxton Road, Lime Creek, lime gulch, MTB, Pine
via http://denver.cbslocal.com/2013/06/19/lime-gulch-fire-breaks-out-in-jefferson-county/
Buffalo Creek evacuated.
Filed under: maps, Uncategorized | Tags: arson, Black Forest, Colorado Springs, El Paso County, forest fire, Gabbert, wildfire
June 14. Not able to see streets very well. Via Bill Gabbert’s Wildfiretoday.com.
http://wildfiretoday.com/2013/06/12/black-forest-fire-colorado-springs/

click to enlarge
Filed under: maps | Tags: bitumen, crude oil, Enbridge, environment, Exxon, oil sands, oil spill, oil transportation, pegasus, pegasus line, pipeline rupture oil, tar sands
The Pegasus line through Arkansas is spewing its contents into a subdivision.

click to enlarge
Filed under: maps | Tags: block group level, california, census block, Chinatown, climate, electricity consumption, energy, energy consumption, energy use, kilowatt hours, Los Angeles, sustainable communities, unsustainable communities, urban
Here: http://sustainablecommunities.environment.ucla.edu/map/

This map displays average monthly energy consumption in kilowatt hours (kWh) at the Census block group level between January 2011 and June 2012.
Goes nicely with the NYC report “NYC Energy Benchmarking Report for Non-Residential Properties”.
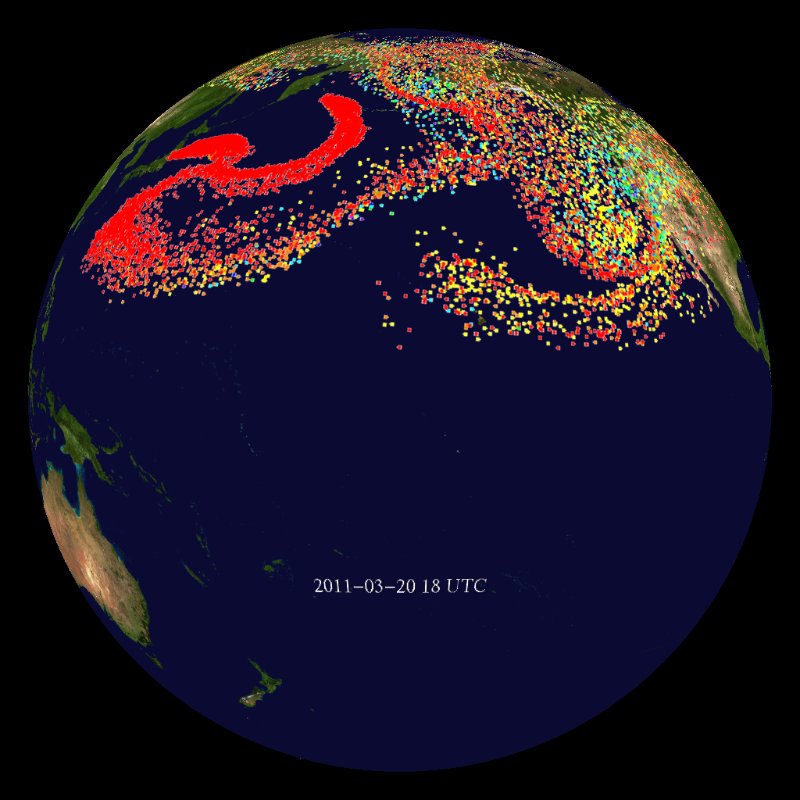
Filed under: maps | Tags: bone cancer, cesium, Cesium-137, contamination, Fukushima, HYSPLIT, hysplit model, Iodine-131, meltdown, multiple meltdown, NOAA, radiation, radioactive cesium, thyroid cancer
NOAA’s HYSPLIT model shows clouds of highly radioactive Cesium wafting over the US after Fuku blew sky high. Only one month’s worth shown.
To see animation:
http://www.sos.noaa.gov/Datasets/dataset.php?id=332

Filed under: maps | Tags: CH2M Hill, Cold War, FBI, Great Western Reservoir, Indiana Street, Jefferson County Parkway, Krey and Hardy, nuclear weapons, Plutonium, radioactive contamination, radioactive particles, Rockwell International, Rocky Flats, Standley Lake
…is about more than spreading the cancer of suburban development. It is also the latest installment in a long project to cover up history and erase responsibility.

click to enlarge
Distribution of plutonium contamination from Rocky Flats in becquerels per square meter (one becquerel equals one disintegration or burst of radiation per second). The original version of this map was prepared by P. W. Krey and E. P. Hardy of the Atomic Energy Commission’s Health and Safety Laboratory, New York City, and published in their 1970 report, “Plutonium in Soil Around the Rocky Flats Plant,” HASL 235. Sampling done in September 2011 along Indiana St. by independent scientist Marco Kaltofen showed that present deposits of plutonium are roughly equivalent to the levels measured by Krey and Hardy in 1970. The dotted red line shows the route of the proposed Jefferson Parkway.
via Leroy Moore: Rocky Flats and the Risk Society | LeRoyMoore's Blog.
Filed under: maps, Uncategorized | Tags: crude oil supply, Cushing, EIA, energy, oil pipelines, oil transportation, petroleum products, pipeline map, refineries, US oil production, WTI

Via EIA:
This Week In Petroleum Summary Printer-Friendly Version.
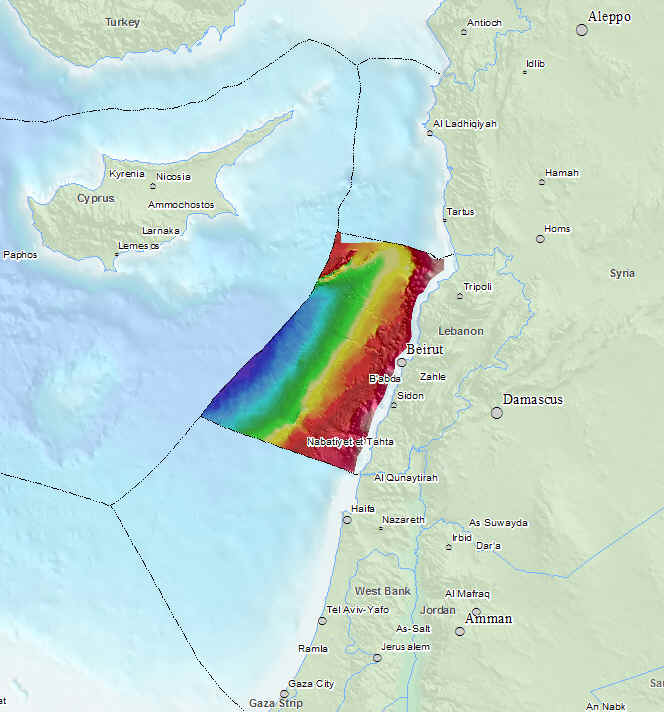
Filed under: maps | Tags: Assem Abou Ibrahim, EEZ, Lebanon, licensing, MEOW, MEW, oil and gas exploration, oil exploration, oil production, PA
…has never been explored for hydrocarbons.
On behalf of the newly formed Petroleum Administration (PA), I would like to welcome you to this website that will focus on matters related to the 1st licensing round for hydrocarbon exploration within the Lebanese offshore EEZ (Exclusive Economic Zone). The PA would also like to thank the Ministry of Energy and Water (MEW) for its continued support during the transition process.
via LEB Licensing Round.
Filed under: maps, Uncategorized | Tags: al Qaeda, AQIM, China, coup, France, Germany, Libya, Mali, Qaddafi, realpolitik, Sanogo, Taureg, Toure, UN
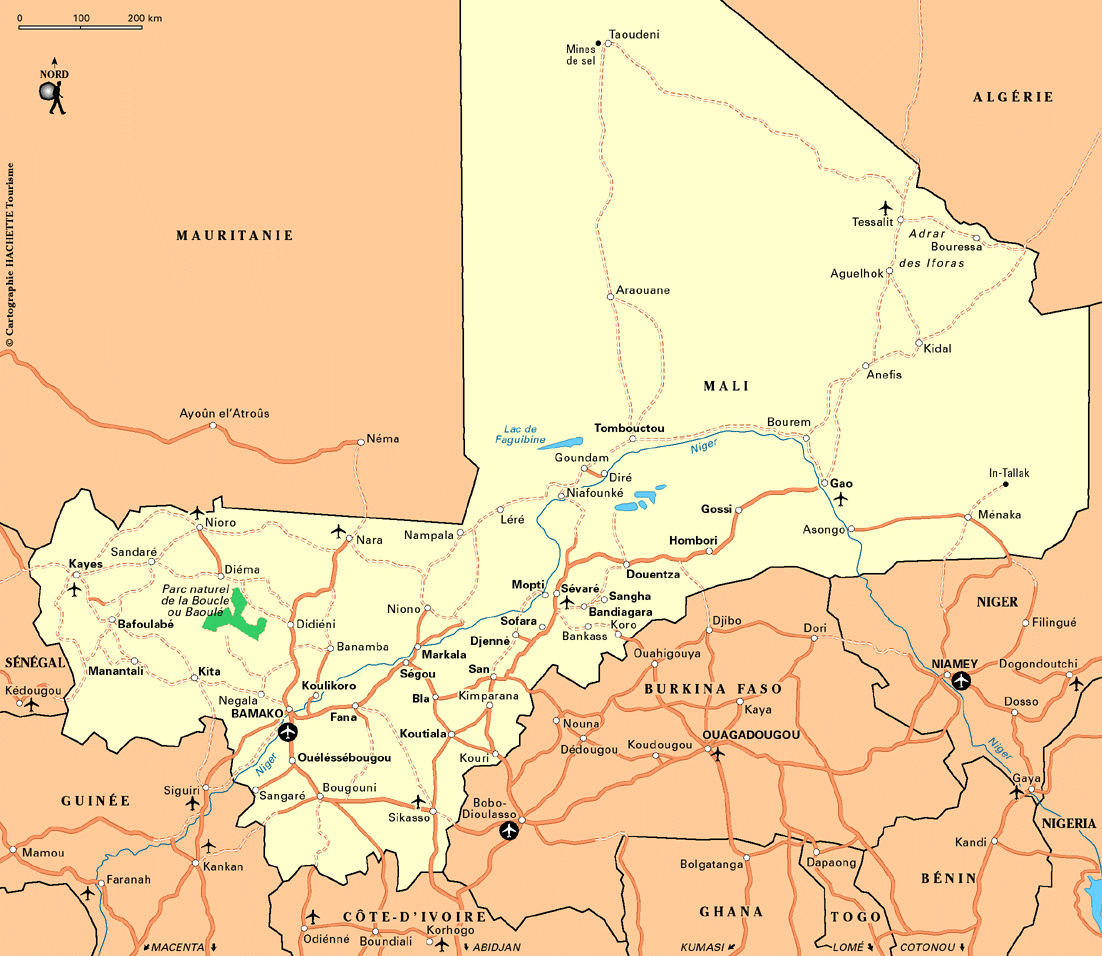
click to enlarge
By no means unknown…
Former president Touré, who came to power in a coup in 1991, enjoyed US military and economic support for many years. According to figures released by the US government, Washington backed Mali with $138 million in 2011 and planned to increase its support to $170 million in 2012. A joint military manoeuvre between US forces and the Mali army took place in January.
The new ruler is by no means unknown to the US government. Sanogo took part in language training courses in Texas from August 2004 until February 2005. In 2007, he was schooled by the US Secret Service and trained as an infantry officer in Georgia for five months.
It is quite possible that Sanogo’s coup was arranged in cooperation with the US government. However, imperialist forces will not be happy with the result because Mali’s north is still in the hands of the insurgents. A future UN intervention supported by the US cannot be excluded, because for Washington, Mali is particularly important from the standpoint of containing Chinese influence in Africa.
Just as the international intervention in Libya was aimed in part at denying China access to North African oil, a military intervention in Mali in cooperation with the US would target Chinese influence in the country.
This influence has grown in recent years. Chinese direct investments in Mali increased 300-fold from 1995 to 2008. Mali ranks with Zambia, South Africa and Egypt among African countries where China has made its largest investments.
In addition to the United States, France also has an intense interest in its former colony, and is just waiting to “rescue” the country’s cultural heritage with a military intervention backed by the UN Security Council. ….
Map and text via http://mediarevolution-amat.blogspot.com/2012/08/western-powers-preparing-intervention.html
Filed under: maps | Tags: Argentina, BHP Billiton, Borders and Southern Petroleum, cute wars, Falkland Islands, Malvinas, North Sea, oil production, Rockhopper, Sea Lion, UK oil production
From oilvoice.com: http://www.oilvoice.com/n/Falkland_Islands_The_New_North_Sea/614e4d43b.aspx
The prospect of the Falkland Islands developing into a major oil producing region has captured the imagination of geologists and investors alike for decades. For many, the area has significant potential as a new ‘North Sea’, bringing opportunities for oil and services companies for years to come. The exploration area surrounding the Falklands to which the UK has a territorial claim is some fifty percent larger than the UK’s portion of the North Sea. In fact, despite being thousands of miles apart there are many similarities between the two. Environmental conditions and water depth are comparable to those west of the Shetland Islands, whilst in terms of geology the basins of the Falkland Islands possess structures similar to those found in the North Sea. The exploration area itself is separated into the geologically distinct North Basin, where the Sea Lion discovery was made, and the South Basin where fellow explorers Falkland Oil & Gas and Borders and Southern Petroleum intend to embark on their own campaign from the end of 2011 having secured an additional rig.
Despite the recent success, there are still those who doubt the Falkland Islands will ever see large scale oil production.

