


Filed under: Uncategorized | Tags: APUS, cargo, containership, hazardous materials, Japan, Kobe, maritime disasters, ONE, shipping, shipping containers, transport
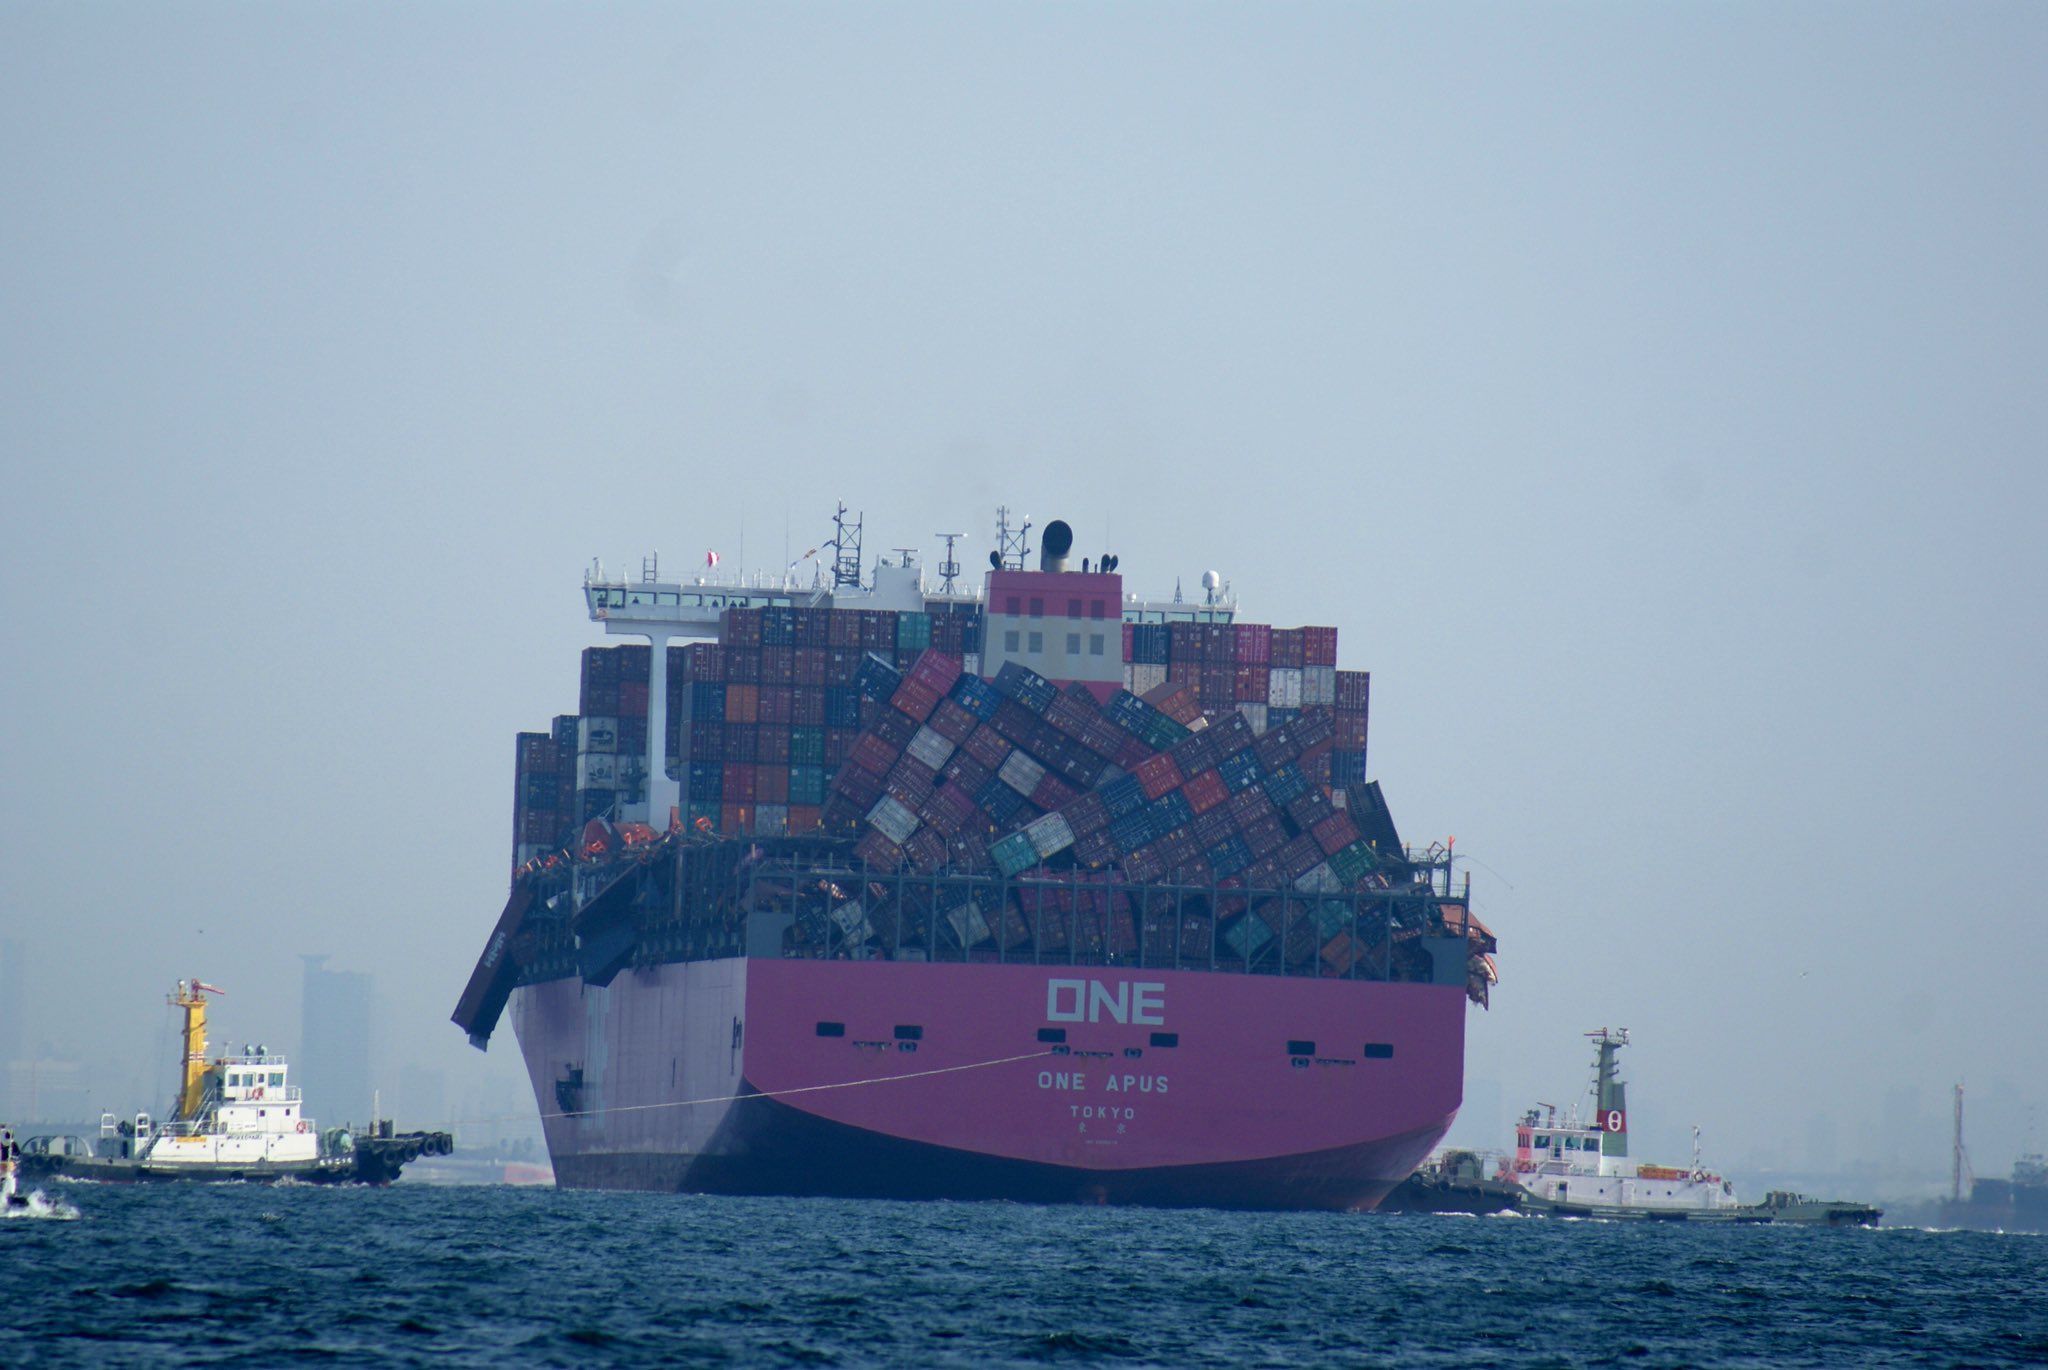
A storm tossed the containership ONE and dumped almost 2,000 containers into the ocean, including some containing hazardous materials. The ship lumbered into port in Kobe, Japan on December 8, 2020.
via
ももかまる
⚓️ (@mrnkA4srnrA) tweeted at 8:28 PM on Mon, Dec 07, 2020:
ONE APUS目当てに報道?のカメラマンわりとおったけどどっかで流れたりする? https://t.co/NV0dD9lkUA
(https://twitter.com/mrnkA4srnrA/status/1336150591031001089?s=03)
Filed under: Uncategorized | Tags: buses, elevated trains, light rail, public transit, trains, transport, transportation, transportation policy, USA Today, Vmt
And another USA Today story…
He says ridership on what’s called heavy rail — subways and elevated trains — increased in 14 of the 15 systems that have such transit. Use of light rail — streetcars and trolleys — rose in 25 of the 27 cities that have it. And 34 of 37 large cities saw increases in bus ridership.
via Use of public transit is soaring in 2012 – USATODAY.com.
Filed under: Uncategorized | Tags: diesel electric, e-highway, electric freight trucks, Germany, industrialized cyclist, journalism alert, Long Beach, Port of Los Angeles, Siemens, transport
It’s a great city to start in: according to the Los Angeles Times, 40 per cent of the cargo freight that enters the US comes through ports in Long Beach and Los Angeles before being shipped down the highway. Cargo trucks in the US consume nearly 2.5 million gallons of oil per year and improvements to their efficiency lag far behind those to cars.
Once the lines are in place, all eHighway would need is a fleet of hybrid diesel-electric trucks that could switch back to diesel power as soon as they go off the overhead lines. Siemens says that system is nearly seamless: in the test project in Germany, the trucks could switch between diesel and electric power at speeds of up to 90 miles per hour.
via One Per Cent: Green Machine: Electric freight trucks coming to LA.
Ich bin ein stromer!!
See the I.C. Energy & Transport Page for more on this subject.
BTW, energy journalism alert — “Cargo trucks in the US consume nearly 2.5 million gallons of oil per year…”
America uses several million barrels of oil (42 gal./barrel) per day in non-passenger transport. The journalist decreased the consumption of America’s goods trucks to a tiny fraction of the real number, and was still impressed.
Filed under: maps, Uncategorized | Tags: energy, New Zealand, oil spill, petroleum, Rena, tanker, transport

“The wreck of the Greek-owned Rena was described as New Zealand’s worst maritime environmental disaster even before the rear section of the ship, lashed by pounding seas, broke away yesterday. The ship has already spilled heavy fuel oil that fouled pristine North Island beaches and killed up to 20,000 seabirds, and despite salvage efforts nearly 400 tonnes of oil remain onboard.”
via New Zealand braces for oil spill as Rena splits on reef | The Australian
Filed under: maps, Uncategorized | Tags: 1971, Amtrak, Gregor McDonald, Obama, passenger rail, rail, railway map, transport, transportation
Via Gregor McDonald’s blog, showing massive loss of inter-urban lines from ’62 to ’71. Gregor calls on Obama to support passenger rail.

click to enlarge
Filed under: maps, Uncategorized | Tags: exports, James Hamilton, petroleum, pipelines, product pipelines, Suncor, transport, transportation, United States

click to enlarge
The blue lines are product pipelines. Greens are oil and reds are gas.
From this James Hamilton post on the petroleum product net export situation.
Filed under: Uncategorized | Tags: cargo ship speed, international trade, Sail Transport Network, shipping, transport, transportation
Is this true?
http://www.calculatedriskblog.com/2011/12/aar-rail-traffic-increased-in-november.html

